Maps of clusters of states with the highest kidney cancer rates in the USA
Below are maps of clusters of states with the highest kidney cancer rates in the USA. The clusters were found by counting the number of shared borders among states with the highest kidney cancer incidence and mortality rates for every combination of gender and race/ethnicity.
Included are also the lists of states with the highest kidney cancer rates.
To learn more about this study, please read the main article. You may also want to read the map guidelines and glossary of terms.
You can view geographic clusters involving other cancers:
White men kidney cancer incidence rates
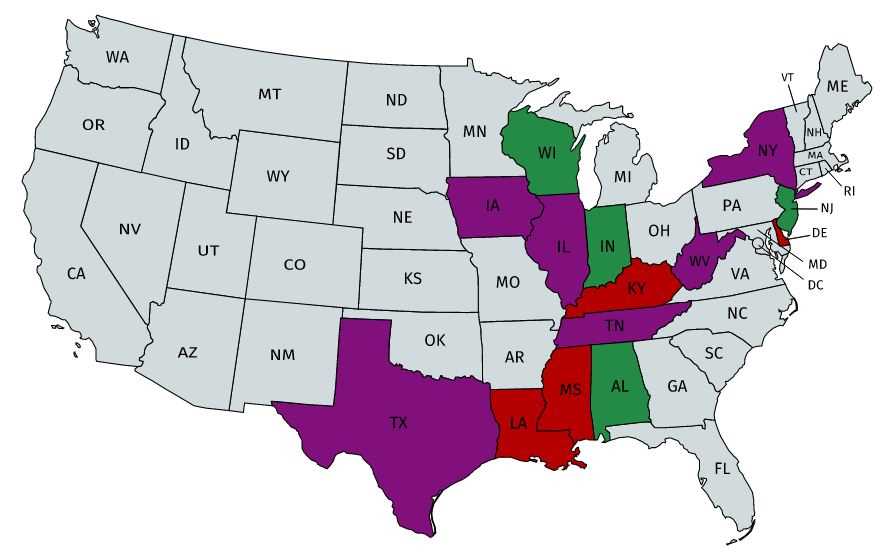
Figure 1: A cluster of states with the highest kidney cancer incidence rates of white men
Shared-border ratio: 107% (16 shared borders among 15 states)
List of states with highest rates:
| State | Rate (per 100,000) | Color | |
|---|---|---|---|
| 1 | Louisiana | 28.4 | |
| 2 | Kentucky | 26.3 | |
| 3 | Delaware | 25.1 | |
| 4 | Mississippi | 25 | |
| 5 | Iowa | 24.4 | |
| 6 | Texas | 24.4 | |
| 7 | New York | 23.4 | |
| 8 | Illinois | 23.1 | |
| 9 | West Virginia | 23.1 | |
| 10 | Tennessee | 23 | |
| 11 | Rhode Island | 22.9 | Not In Cluster |
| 12 | Indiana | 22.8 | |
| 13 | Wisconsin | 22.8 | |
| 14 | Alabama | 22.7 | |
| 15 | New Jersey | 22.5 |
(Number of states in the contiguous U.S. with numerical cancer rates in the CDC file: 48)
Hispanic men kidney cancer incidence rates
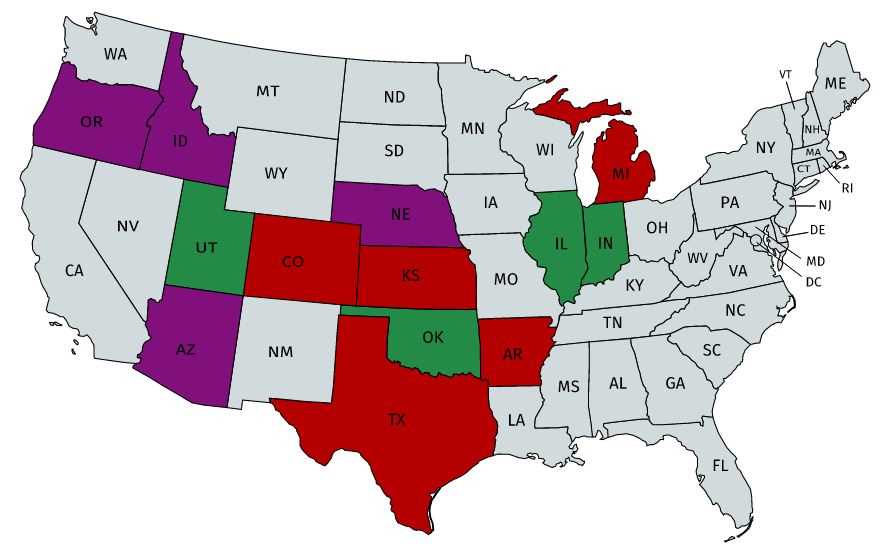
Figure 2: A cluster of states with the highest kidney cancer incidence rates of Hispanic men
Shared-border ratio: 107% (16 shared borders among 15 states)
List of states with highest rates:
| State | Rate (per 100,000) | Color | |
|---|---|---|---|
| 1 | Kansas | 31.5 | |
| 2 | Arkansas | 29.5 | |
| 3 | Texas | 25.9 | |
| 4 | Colorado | 25 | |
| 5 | Michigan | 25 | |
| 6 | Arizona | 24.3 | |
| 7 | Idaho | 24 | |
| 8 | Nebraska | 23.2 | |
| 9 | Oregon | 22.8 | |
| 10 | Minnesota | 21.7 | Not In Cluster |
| 11 | Illinois | 21.6 | |
| 12 | Connecticut | 21.4 | Not In Cluster |
| 13 | Utah | 21 | |
| 14 | Oklahoma | 20.8 | |
| 15 | Indiana | 20.6 |
(Number of states in the contiguous U.S. with numerical cancer rates in the CDC file: 33)
White men kidney cancer mortality rates

Figure 3: A cluster of states with the highest kidney cancer mortality rates of white men
Shared-border ratio: 153% (23 shared borders among 15 states)
List of states with highest rates:
| State | Rate (per 100,000) | Color | |
|---|---|---|---|
| 1 | Oklahoma | 7.7 | |
| 2 | Louisiana | 7 | |
| 3 | Iowa | 6.9 | |
| 4 | Mississippi | 6.9 | |
| 5 | Arkansas | 6.8 | |
| 6 | Tennessee | 6.8 | |
| 7 | Kentucky | 6.7 | |
| 8 | Missouri | 6.7 | |
| 9 | Nebraska | 6.7 | |
| 10 | Indiana | 6.6 | |
| 11 | Texas | 6.6 | |
| 12 | Kansas | 6.5 | |
| 13 | Minnesota | 6.5 | |
| 14 | West Virginia | 6.5 | |
| 15 | Maine | 6.4 | Not In Cluster |
(Number of states in the contiguous U.S. with numerical cancer rates in the CDC file: 49)
White women kidney cancer incidence rates
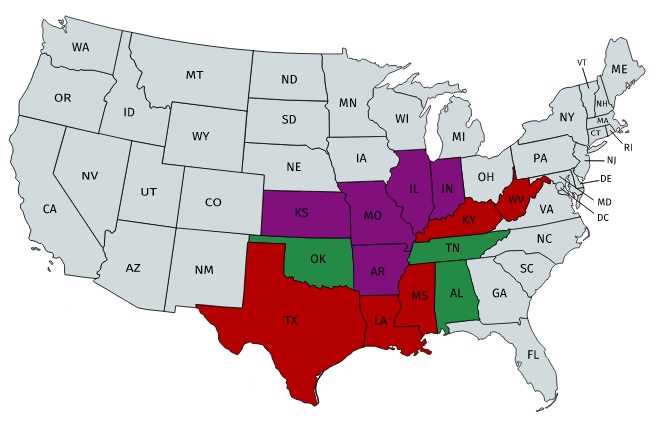
Figure 4: A cluster of states with the highest kidney cancer incidence rates of white women
Shared-border ratio: 153% (23 shared borders among 15 states)
List of states with highest rates:
| State | Rate (per 100,000) | Color | |
|---|---|---|---|
| 1 | Louisiana | 16 | |
| 2 | Kentucky | 14.5 | |
| 3 | West Virginia | 13.7 | |
| 4 | Mississippi | 13.5 | |
| 5 | Texas | 13.3 | |
| 6 | Indiana | 12.9 | |
| 7 | Kansas | 12.7 | |
| 8 | Illinois | 12.6 | |
| 9 | Arkansas | 12.5 | |
| 10 | Missouri | 12.5 | |
| 11 | North Dakota | 12.4 | Not In Cluster |
| 12 | Tennessee | 12.3 | |
| 13 | Alabama | 12.1 | |
| 14 | Oklahoma | 12.1 | |
| 15 | Rhode Island | 12.1 | Not In Cluster |
(Number of states in the contiguous U.S. with numerical cancer rates in the CDC file: 48)
Black women kidney cancer incidence rates
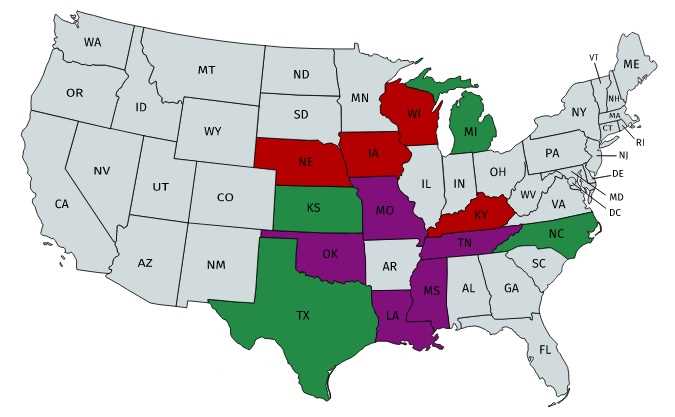
Figure 5: A cluster of states with the highest kidney cancer incidence rates of black women
Shared-border ratio: 113% (17 shared borders among 15 states)
List of states with highest rates:
| State | Rate (per 100,000) | Color | |
|---|---|---|---|
| 1 | Iowa | 26 | |
| 2 | Wisconsin | 18.9 | |
| 3 | Nebraska | 18.5 | |
| 4 | Kentucky | 17.3 | |
| 5 | Mississippi | 16.6 | |
| 6 | Oregon | 16.6 | Not In Cluster |
| 7 | Louisiana | 15.3 | |
| 8 | Missouri | 15.2 | |
| 9 | Tennessee | 15.1 | |
| 10 | Oklahoma | 15 | |
| 11 | Pennsylvania | 14.8 | Not In Cluster |
| 12 | Texas | 14.8 | |
| 13 | North Carolina | 14.7 | |
| 14 | Kansas | 14.6 | |
| 15 | Michigan | 14 |
(Number of states in the contiguous U.S. with numerical cancer rates in the CDC file: 37)
Hispanic women kidney cancer incidence rates

Figure 6: A cluster of states with the highest kidney cancer incidence rates of Hispanic women
Shared-border ratio: 100% (15 shared borders among 15 states)
List of states with highest rates:
| State | Rate (per 100,000) | Color | |
|---|---|---|---|
| 1 | Oregon | 16.7 | |
| 2 | Colorado | 16.4 | |
| 3 | Texas | 15.7 | Not In Cluster |
| 4 | Arizona | 14.9 | |
| 5 | Arkansas | 14.9 | Not In Cluster |
| 6 | Idaho | 14.8 | |
| 7 | Kansas | 14.3 | |
| 8 | Wisconsin | 13.6 | |
| 9 | Utah | 13.2 | |
| 10 | Minnesota | 12.9 | |
| 11 | Illinois | 12.8 | |
| 12 | South Carolina | 12.7 | Not In Cluster |
| 13 | Indiana | 12.6 | |
| 14 | Michigan | 12.2 | |
| 15 | Nebraska | 12.2 |
(Number of states in the contiguous U.S. with numerical cancer rates in the CDC file: 32)
White women kidney cancer mortality rates

Figure 7: A cluster of states with the highest kidney cancer mortality rates of white women
Shared-border ratio: 156% (25 shared borders among 16 states)
List of states with highest rates:
| State | Rate (per 100,000) | Color | |
|---|---|---|---|
| 1 | Louisiana | 3.5 | |
| 2 | South Dakota | 3.3 | |
| 3 | West Virginia | 3.3 | |
| 4 | Arkansas | 3.2 | |
| 5 | Oklahoma | 3.1 | |
| 6 | Kentucky | 3 | |
| 7 | Missouri | 3 | |
| 8 | New Mexico | 3 | |
| 9 | Texas | 3 | |
| 10 | Delaware | 2.9 | Not In Cluster |
| 11 | Indiana | 2.9 | |
| 12 | Kansas | 2.9 | |
| 13 | Ohio | 2.9 | |
| 14 | Illinois | 2.8 | |
| 15 | Iowa | 2.8 | |
| 16 | Michigan | 2.8 |
(Number of states in the contiguous U.S. with numerical cancer rates in the CDC file: 48)
Black women kidney cancer mortality rates
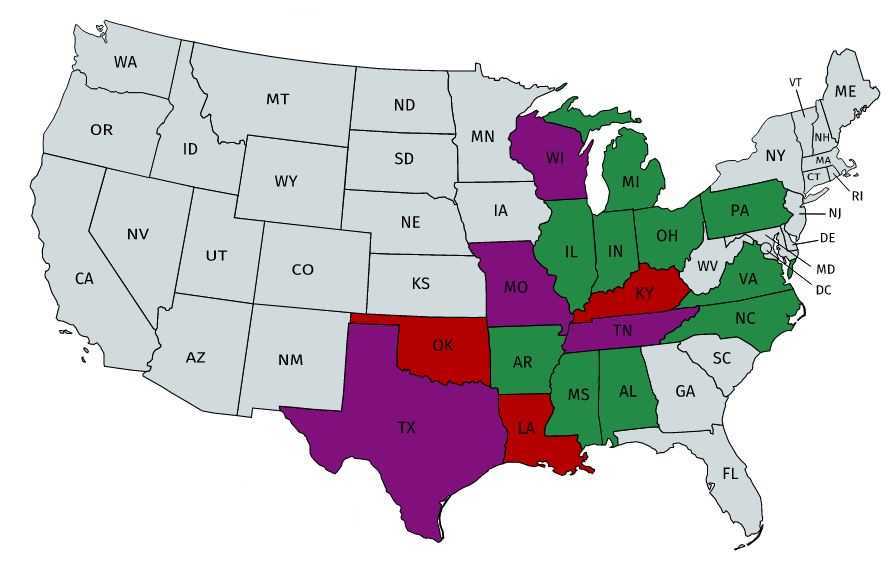
Figure 8: A cluster of states with the highest kidney cancer mortality rates of black women
Shared-border ratio: 168% (32 shared borders among 19 states)
List of states with highest rates:
| State | Rate (per 100,000) | Color | |
|---|---|---|---|
| 1 | Kentucky | 4 | |
| 2 | Nevada | 3.8 | Not In Cluster |
| 3 | Oklahoma | 3.6 | |
| 4 | Louisiana | 3.5 | |
| 5 | Missouri | 3.3 | |
| 6 | Tennessee | 3.3 | |
| 7 | Arizona | 3.2 | Not In Cluster |
| 8 | Wisconsin | 3.2 | |
| 9 | Texas | 3.1 | |
| 10 | Alabama | 2.9 | |
| 11 | Indiana | 2.9 | |
| 12 | Ohio | 2.9 | |
| 13 | Virginia | 2.8 | |
| 14 | Arkansas | 2.7 | |
| 15 | Illinois | 2.7 | |
| 16 | Michigan | 2.7 | |
| 17 | Mississippi | 2.7 | |
| 18 | North Carolina | 2.7 | |
| 19 | Pennsylvania | 2.7 |
(Number of states in the contiguous U.S. with numerical cancer rates in the CDC file: 29)